


At this writing, a Congressional spending impasse and resulting government shutdown is underway. We have been down this shutdown road before, and despite the disruption, prior government closures have been without lasting impact. Research from Dimensional Fund Advisors notes that there have been 11 shutdowns since 1981, and only 4 of those extended beyond 5 days. In 3 of the 4, the US stock market was positive, and in the 4th it was unchanged. For many government employees the effects are decidedly unpleasant, but if history is any guide, overall effect on financial markets should be muted.
The shutdown comes on the heels of a positive quarter for financial assets. For the three months ending September 30, broad US stocks as measured by the Russell 3000 index rose 8.2%, the S&P 500 gained 7.8%, and small US companies as measured by the Russell 2000 climbed 12.4%. International developed market stock prices continued their strong year, rising 5.3% for the quarter and 27% from January 1, and emerging market stocks gained 10.6%, on the heels of a 12% gain the prior quarter. Bond prices rose as the Federal Reserve delivered an expected rate cut, with the Bloomberg Barclays Aggregate up 2% for the quarter and over 6.4% for the year-to-date.

US Stock Market (Russell 3000 Index), International Developed Stocks (MSCI World ex USA Index [net div.]), Emerging Markets (MSCI Emerging Markets Index [net div.]), Global Real Estate (S&P Global REIT Index [net div.]), US Bond Market (Bloomberg Barclays US Aggregate Bond Index), and Global Bond Market ex US (Bloomberg Barclays Global Aggregate ex-USD Bond Index [hedged to USD]) Past performance is no guarantee of future returns.
A major theme as we enter the fall continues to be the large-scale remaking of American policy under the new administration. From trade to immigration to foreign relations to domestic fiscal policy, the Trump team has moved aggressively to implement change. While some impacts are becoming clearer, the longer-term effects are still unknown, leading to significant uncertainty on the part of both corporate America and America’s allies and foes. Let’s look at how this is playing out in financial markets.
Stocks
The benefits of diversified portfolios continue to be evident. Following a lengthy period of US mega-tech dominance, other asset classes have shined. International stocks, smaller companies, bonds, commodities and real estate all have performed positively. Why the swing? We would suggest several possible reasons.
While large US technology companies continue to offer potential for more growth, valuations and concentration are raising caution levels. The “Magnificent 7” have had an outsize impact on market returns. In 2023 they provided 63% of the S&P 500 total return, 55% in 2024, and 45% year-to-date in 2025. Consider the chart below, a study of the top 10 US companies in market valuation by decade. At the start of 2025, the value of these companies as a percentage of overall market was approximately double historical levels. Note that 7 of the 10 are almost pure technology plays. These companies are impressive and are investing massively to gain future growth, particularly from AI. But history suggests that the top 10 companies of any given period typically do not remain at the top indefinitely – other sectors and companies rise to dominance. Again, this does not mean that the “Mag 7” are expected to fail, but it does mean that nothing stays at the top for too long in our dynamic economy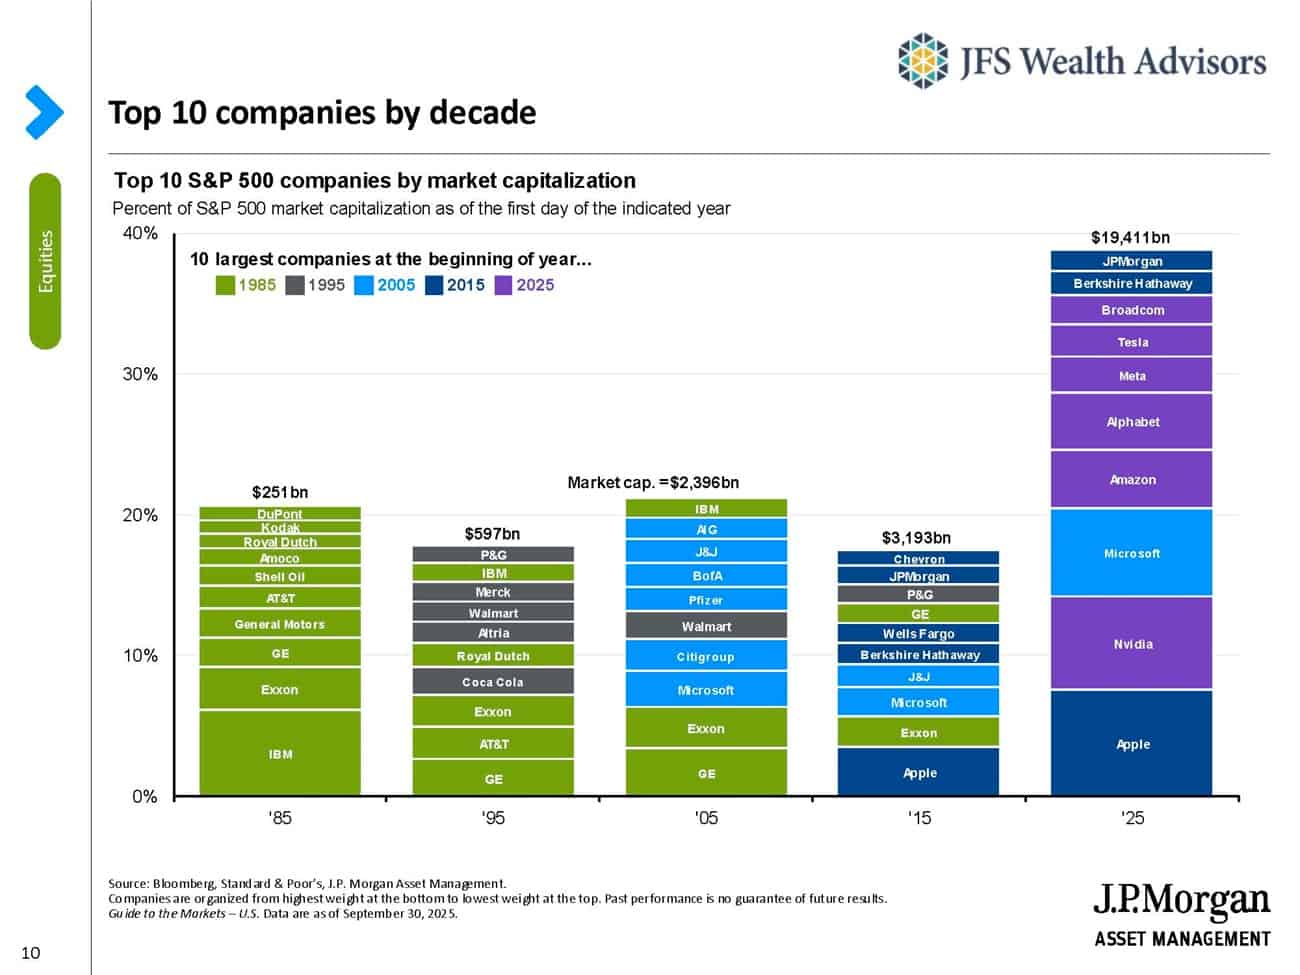
In large part due to these same large technology companies, the S&P 500, based on expected future earnings, trades at an eye-watering price/earnings ratio of 22.8, well above long-term averages. Indeed, as the box insert shows, any standard valuation measure is significantly above average. This does not mean that all US stocks are destined to plunge and should be avoided, but it does mean that future return expectations should be more muted and other, more attractively valued areas and assets should be emphasized.
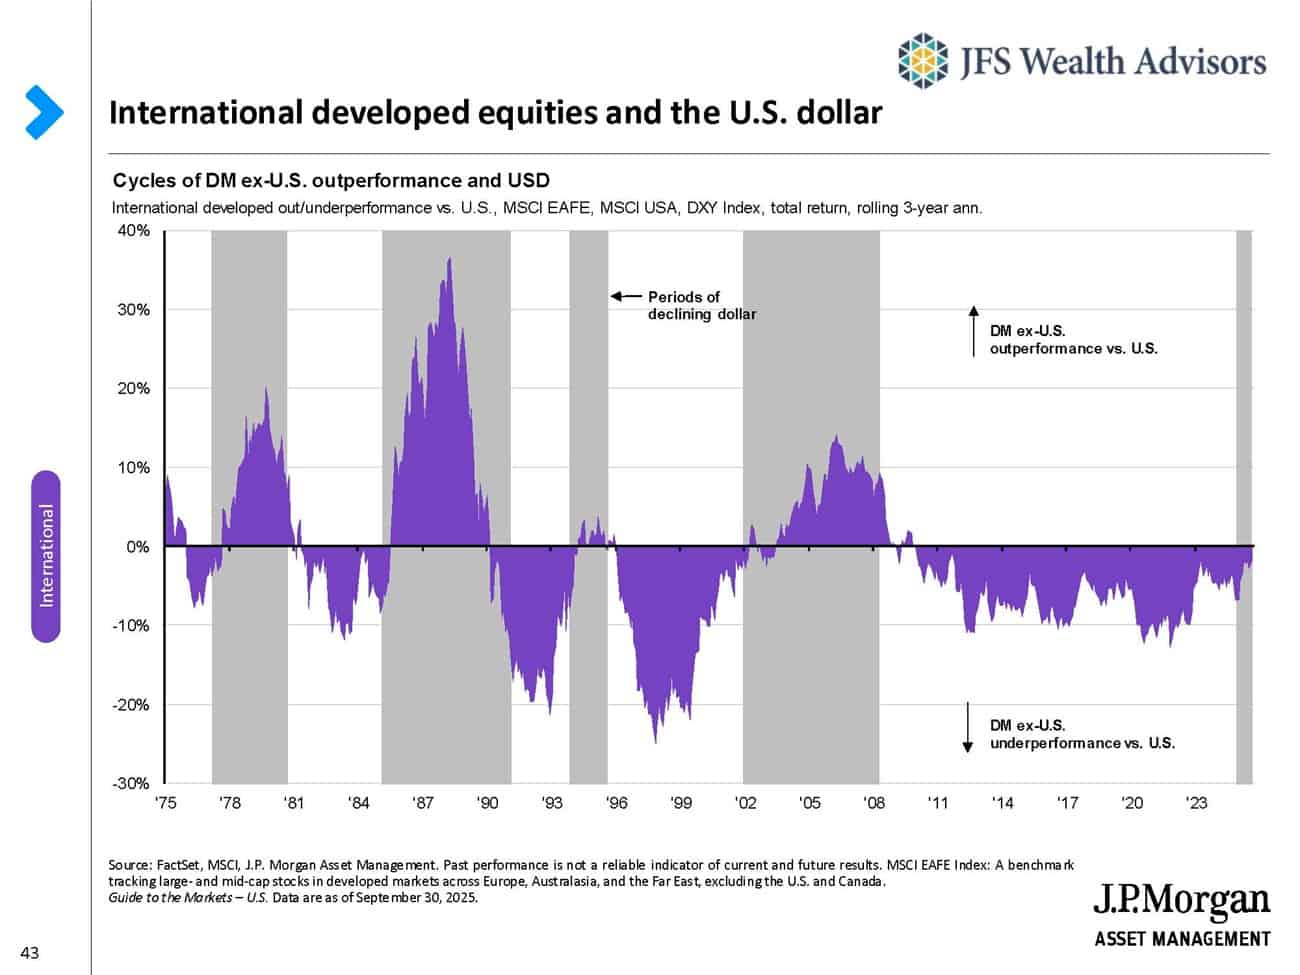
International stocks, both developed and emerging markets, may fit the bill. For most of the past 15 years global stock market returns have strongly favored the US, but in 2025 the tide has turned dramatically, with stocks outside the US strongly outperforming. Multiple factors can be associated with this nascent trend. One is the decline of the dollar against other currencies. From 2008 through 2022 the dollar generally was strong, but since then it has weakened, dropping 10% YTD in 2025 alone. This has provided a boost to foreign stock returns, and although the future is uncertain, current US policies could well continue that dollar movement. In addition, since the 2020 pandemic, foreign company earnings have rebounded in-line or even ahead of their US counterparts. Combine these factors with significantly lower valuation measures – MSCI EAFE trades at a 34% P/E discount to the S&P 500 based on forward earnings – and it is easy to see why foreign markets are having their day in the sun. Another important point is the cyclical behavior of performance of US versus other stock markets. As the chart below demonstrates, when looking at rolling 3-year performance, the switch to foreign markets providing outperformance could well be just beginning. In fact, Gabriela Santos, Chief Market Strategist for JP Morgan’s Guide to the Markets Team, recently noted her expectation that this dynamic is “in the early innings.”
Bonds
In addition to stock diversification benefits, fixed income has similarly been beneficial. Core US bonds have provided positive returns (6.4% YTD) but importantly have again filled their traditional role as a volatility buffer against stocks. Historically the 10-year Treasury bond has had a negative correlation to the S&P 500, meaning it tends to “zig” when stocks “zag.” This is important for the smoother ride that balanced portfolios can bring. With the Federal Reserve beginning to lower rates, core fixed income appears poised to continue to deliver solid contributions.

**Indices used for hypothetical portfolios returns are the MSCI ACWI for equities and the BBgBarc US Agg Bond for fixed income. All data derived from Morningstar Office. Past performance is no guarantee of future returns.
Economics
The US economy has shown impressive resilience, although some cracks are beginning to appear. The second quarter GDP reading of 3.8% was a positive surprise, as corporate America has proved nimble in adjusting to tariffs, and consumers, particularly those on the high-income end, have continued to spend. Services spending remains a bright spot, having gained in 13 of the past 14 months, and up 1.9% in August alone. Of course, the big question is whether this will continue, and the recent slowdown in jobs growth provides the clearest sign that caution may be warranted. The August report from the Bureau of Labor Statistics showed only 22,000 new jobs created (September’s report is delayed due to the shutdown), and a soft 3-month average of 29,000: a dramatic slowdown from the 146,000, 12-month average at the end of the last quarter. On September 26 the Wall Street Journal ran an article entitled “The Auto Industry Is Flashing a Warning Sign on the U.S. Economy.” Add all this together and, coupled with a corresponding decline in the number of jobs available for searchers as well as a significant decline in immigration, and we see a US labor market that is signaling weakness. Which leads us to the Fed.
On September 17 the Federal Reserve Open Market Committee announced its first rate cut in over 9 months – a one-quarter of one percent (0.25%) rate cut to a target range of 4.0% – 4.25%. We noted last quarter the highly vocal pressure on the Fed by President Trump and his team to aggressively lower rates, but every member except one voted for the incremental drop of 0.25%. This is likely to be the first of several cuts in this cycle, although Fed Chair Jerome Powell continues to be clear that the Fed is minding both sides of its employment and inflation mandate. At 2.9%, the latest reading of the Fed’s preferred inflation gauge (Personal Consumption Expenditures, or PCE), inflation remains above their long-term target of 2.0%. The Fed is balancing conflicting risks (inflation vs employment), and it continues to be a tightrope walk as they face sticky inflation on the one hand, and a weakening labor market on the other. However, comments by Powell and others, along with data from their meeting, suggest further rate cuts this year and into 2026.
Other data paint a similarly mixed picture. ISM manufacturing data posted its sixth consecutive monthly decline, and over those same six months the index of Leading Economic Indicators likewise fell 2.8%. Taken together, these indicate a cautious approach to corporate investments and hiring (outside of AI). Respondent comments from the ISM manufacturing survey laid the unease squarely at the feet of the ongoing tariff situation and the resultant policy and planning uncertainty. Today’s effective tariff rate on imports is approximately 19%, down from the whopping 30% level following “Liberation Day” on April 2. With many tariffs, the approach has been to go big at the start, and then quietly step back and negotiate a lower outcome that is more favorable to both sides. Corporate America has mostly resisted – so far – passing on these increased costs to consumers. But the large pre-tariff inventory buildup is about gone, and any efforts to shift production to the US are still on the drawing board. Coupled with a sharply lower immigration rate, fears of persistent inflationary pressures remain real. Dr. David Kelly of JP Morgan referred to the “fog bank” in which many businesses are operating today, and more time is required to see exactly how these trade upheavals play out.
Other items of note; The yield on the 10-year treasury ticked down slightly, ending the quarter at 4.14%. Crude oil prices fell by 3.96%, finishing the quarter at $62.51. The price of gold continued its massive surge, gaining another 16.97% in Q3, closing the quarter at $3,882.60 (at this writing, gold is trading at or near $4,000, an all-time high).
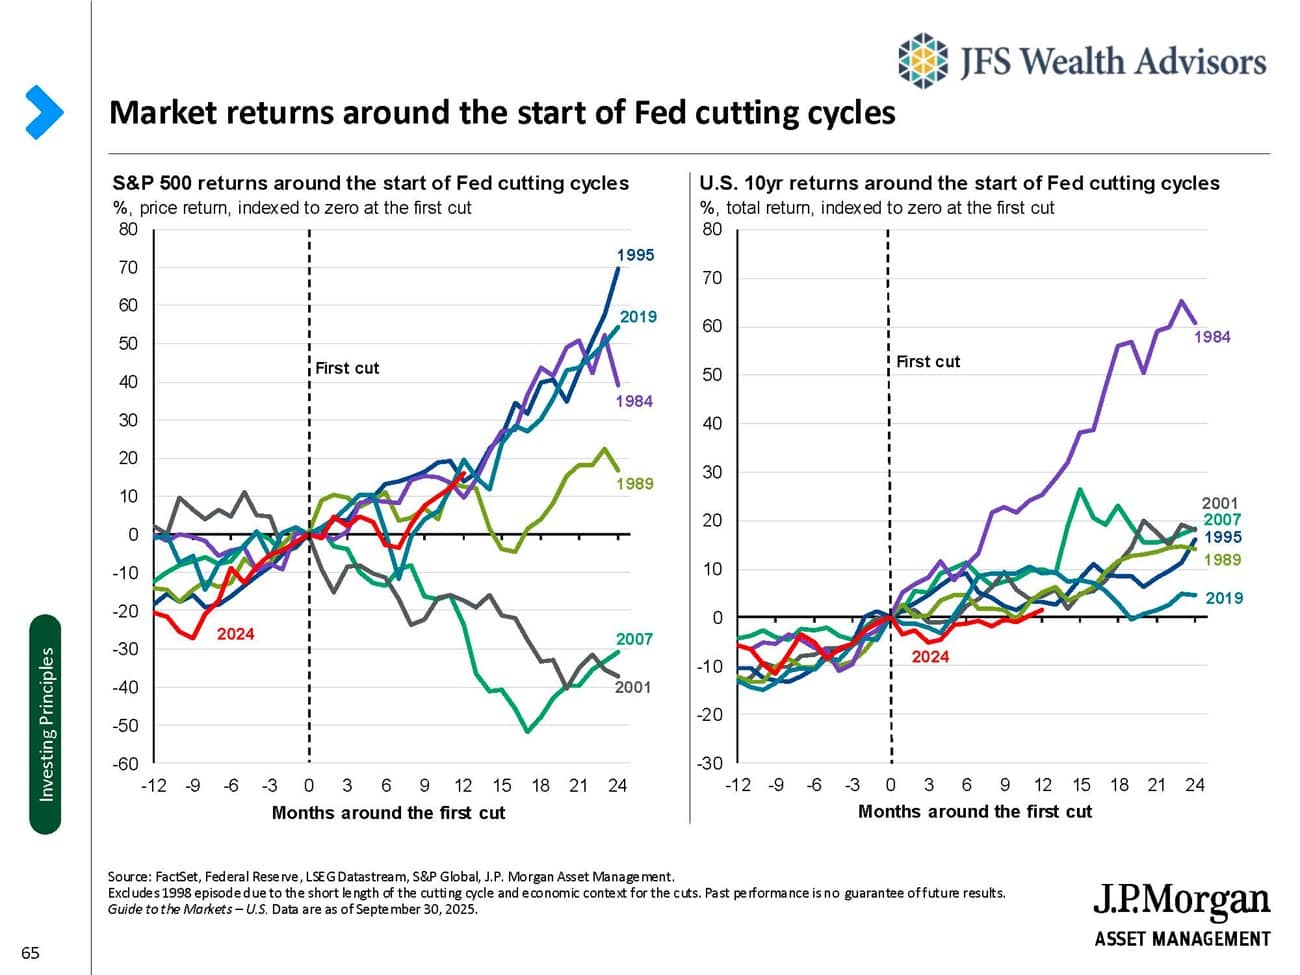
While the future path of interest rates, inflation, and market returns is unknowable, historical data provides a guide. As the chart below shows, there have been six major rate cutting cycles since 1989. US stocks have gained in 4 of those 6 cycles, but bonds have gained in all: a perfect batting average. Each cycle has its own characteristics and drivers, and we have noted the tug of war in this one between inflation and growth, uncertain policy, and high US stock valuations. However, armed with data, it is reasonable to be cautiously optimistic that bonds will continue to provide income and volatility protection, and properly diversified stocks can deliver positive risk-adjusted returns.
All of us are experiencing – whether we realize it or not – AI inserting itself into our daily lives. There is vigorous debate around how far this will go, but AI is here to stay. With that in mind, we asked Claude (Anthropic’s large language model) to summarize the path forward from here. Below is what was generated – well said, in our view!
Looking ahead, the global economy faces a period of divergent paths, with the strength of recovery dependent on how tariff policies evolve, whether inflation pressures moderate, and whether the AI-driven productivity gains materialize into broader economic benefits.
While these broad trends are helpful to note, it is important that your unique and individual goals and objectives are matched to your risk tolerance and current asset mix. Please contact your JFS team with any questions and to review your planning outlook.
Please remember that past performance is no guarantee of future results. Different types of investments involve varying degrees of risk, and there can be no assurance that the future performance of any specific investment, investment strategy, or product (including the investments and/or investment strategies recommended or undertaken by JFS Wealth Advisors, LLC [“JFS]), or any non-investment related content, made reference to directly or indirectly in this commentary will be profitable, equal any corresponding indicated historical performance level(s), be suitable for your portfolio or individual situation, or prove successful. Due to various factors, including changing market conditions and/or applicable laws, the content may no longer be reflective of current opinions or positions. Moreover, you should not assume that any discussion or information contained in this commentary serves as the receipt of, or as a substitute for, personalized investment advice from JFS. JFS is neither a law firm, nor a certified public accounting firm, and no portion of the commentary content should be construed as legal or accounting advice. A copy of the JFS’ current written disclosure Brochure discussing our advisory services and fees continues to remain available upon request or at www.jfswa.com. Please Remember: If you are a JFS client, please contact JFS, in writing, if there are any changes in your personal/financial situation or investment objectives for the purpose of reviewing/evaluating/revising our previous recommendations and/or services, or if you would like to impose, add, or to modify any reasonable restrictions to our investment advisory services. Unless, and until, you notify us, in writing, to the contrary, we shall continue to provide services as we do currently. Please Also Remember to advise us if you have not been receiving account statements (at least quarterly) from the account custodian.